Start top 5 gainer
|
Title |
Description |
Sector |
Signals |
MAX(Date) |
Open |
Close |
Buy9 |
Buy20 |
DiffBuy9 |
| 0 |
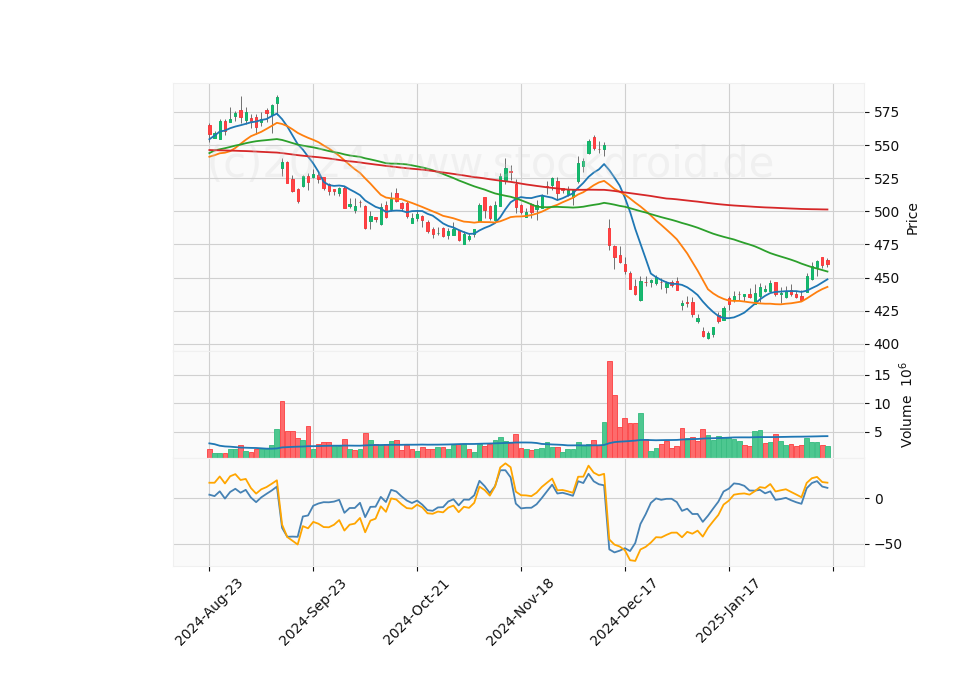
ADBE |
Adobe Inc. |
Software Infrastructure |
3 |
2025-02-12 |
439.25000 |
451.10001 |
10.97112 |
16.88251 |
17.11222 |
| 1 |
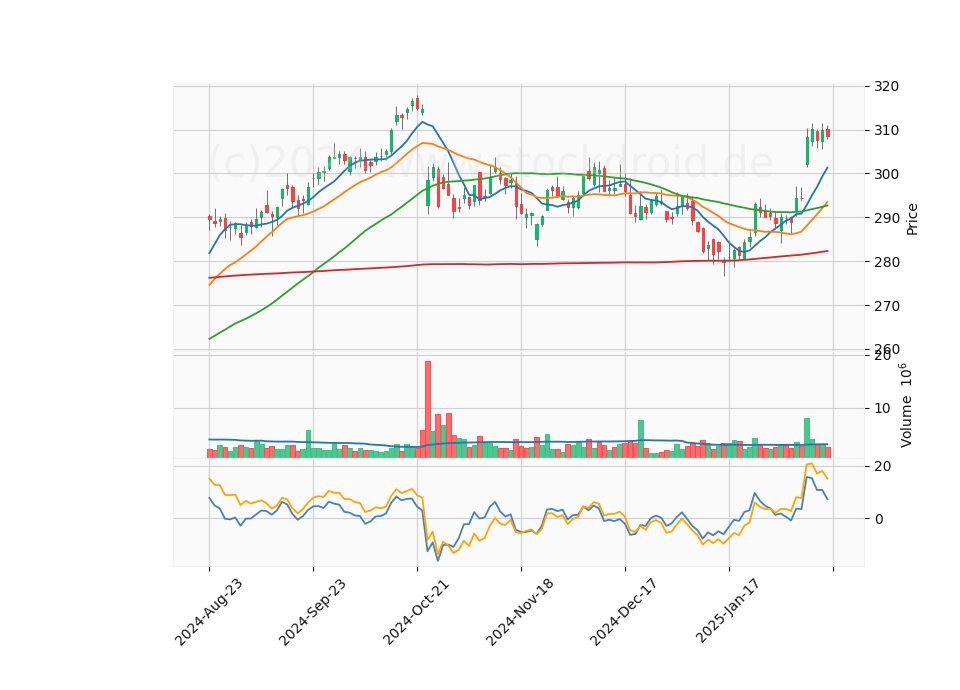
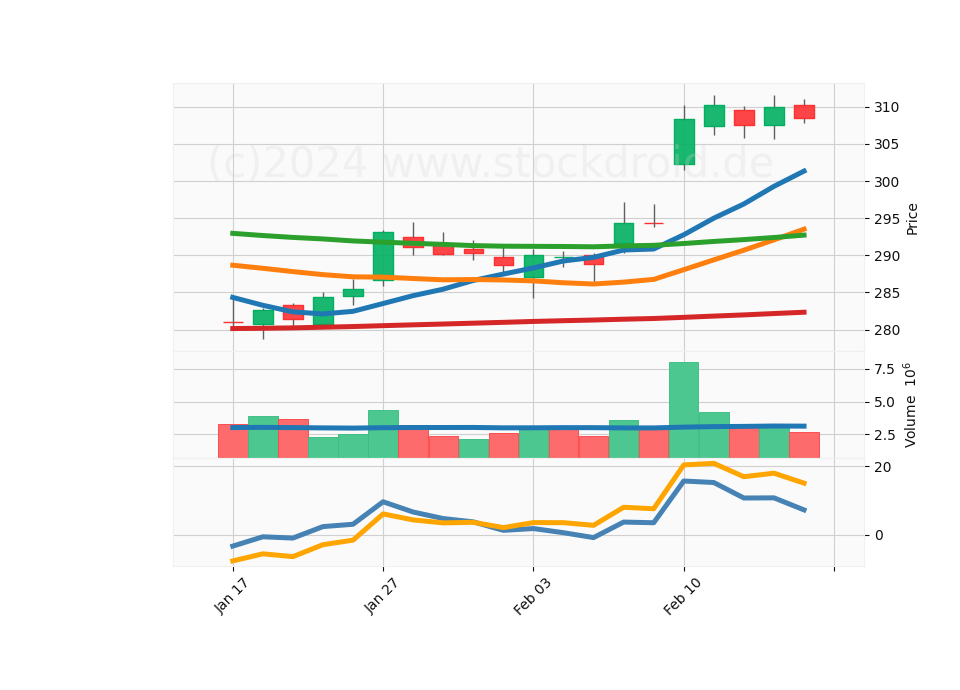
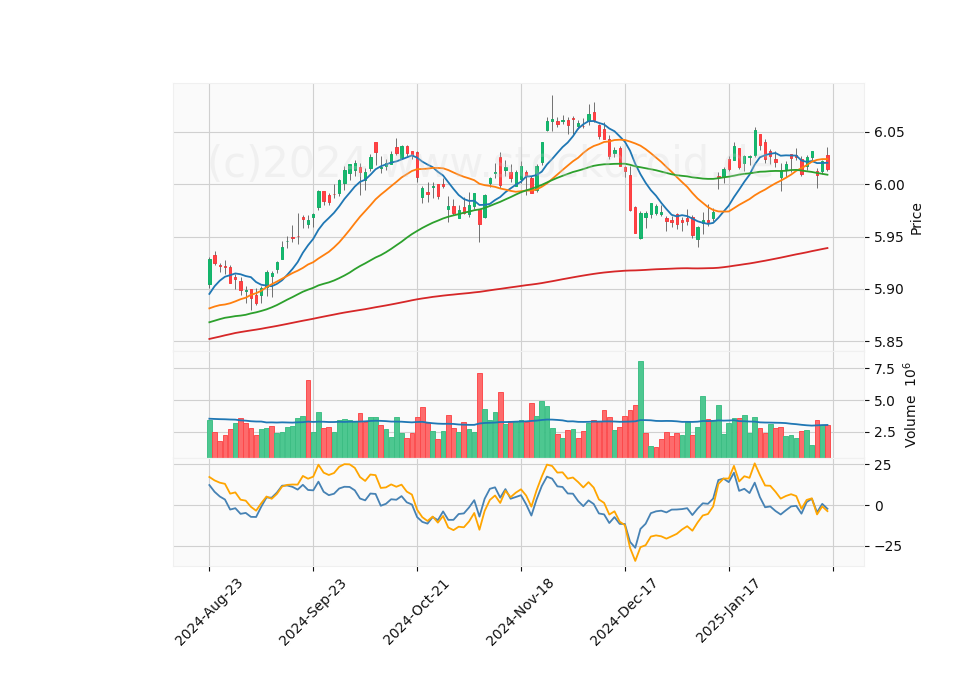
MCD |
McDonald's Corporation |
Restaurants |
3 |
2025-02-13 |
302.26999 |
308.42001 |
15.65779 |
20.36251 |
12.20113 |
| 2 |
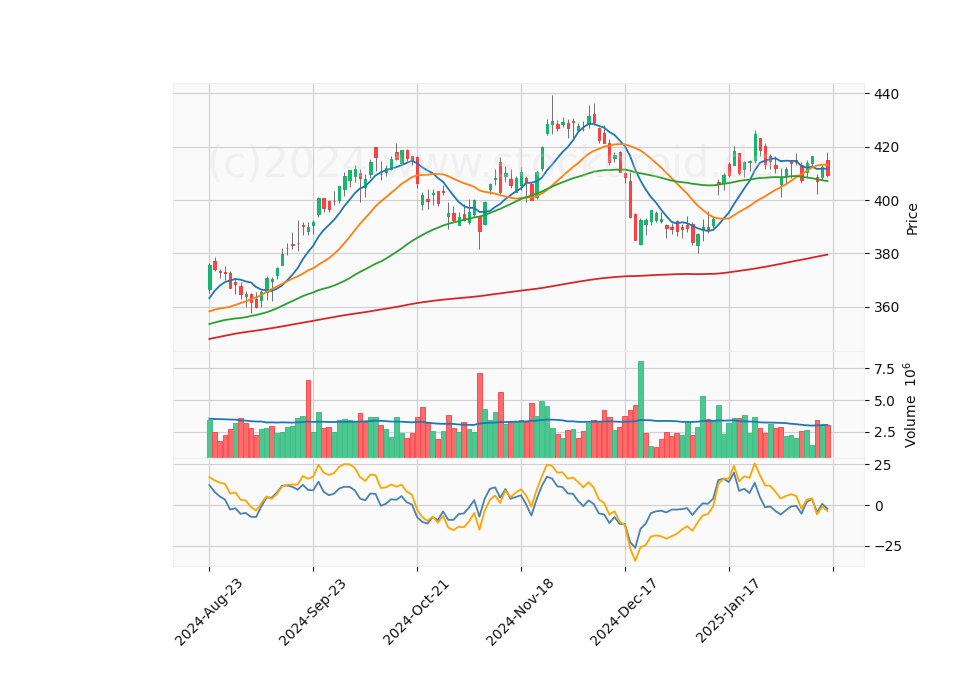
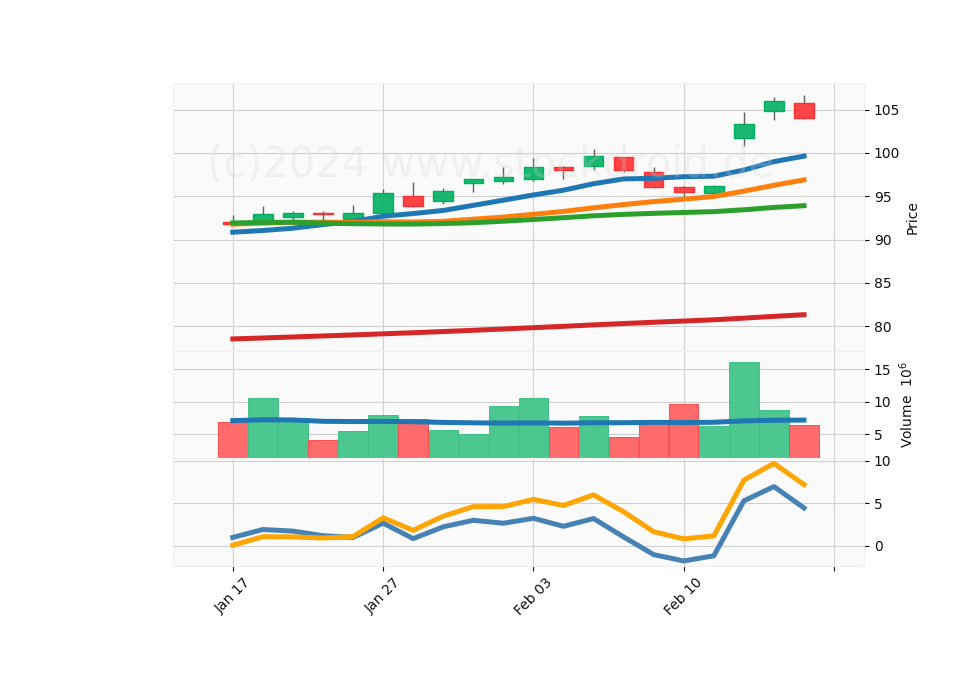
HD |
The Home Depot Inc. |
Home Improvement Retail |
2 |
2025-02-11 |
410.64001 |
413.98999 |
1.82443 |
3.12149 |
7.15777 |
| 3 |
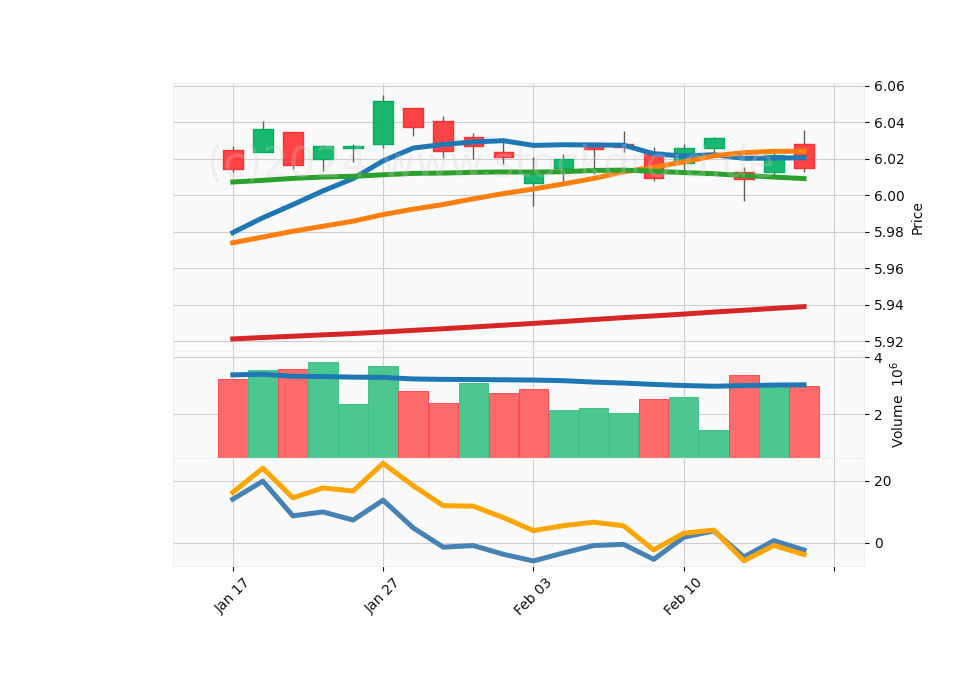
GILD |
Gilead Sciences Inc |
Drug Manufacturers |
2 |
2025-02-13 |
101.74000 |
103.31000 |
5.28444 |
7.71850 |
6.46333 |
| 4 |
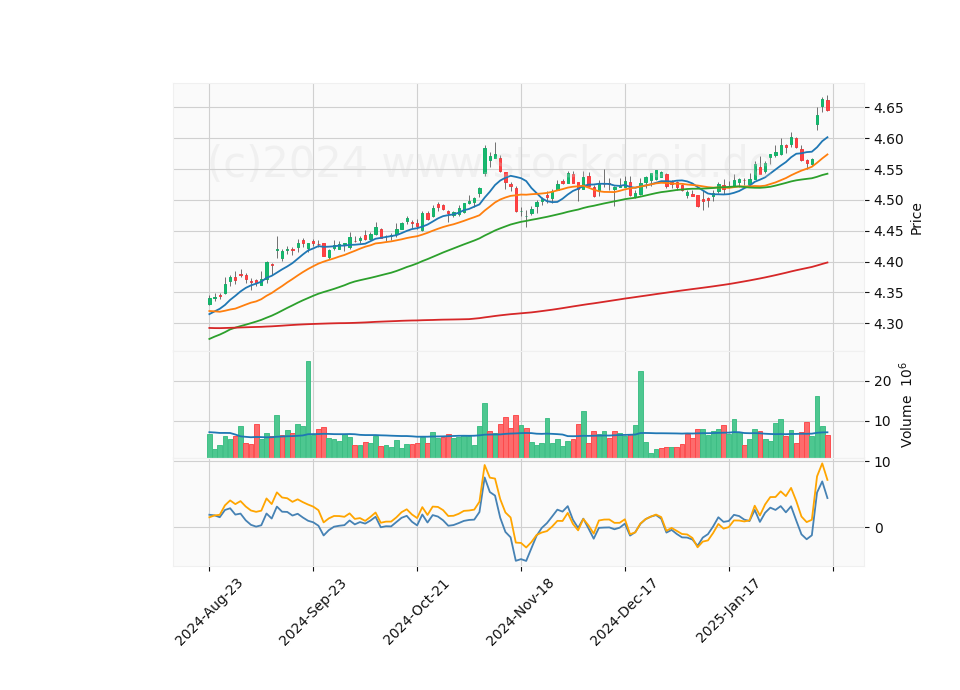
NUE |
Nucor Corporation |
Steel |
3 |
2025-02-14 |
136.80000 |
137.53000 |
6.38445 |
10.73900 |
6.05001 |
Start
ADBE Yahoo Stock Infos
ADBE Google Stock Infos
|
ID |
AquisitionDate |
Date |
Title |
Open |
Close |
Buy9 |
Buy20 |
DiffBuy9 |
DiffBuy20 |
| 0 |
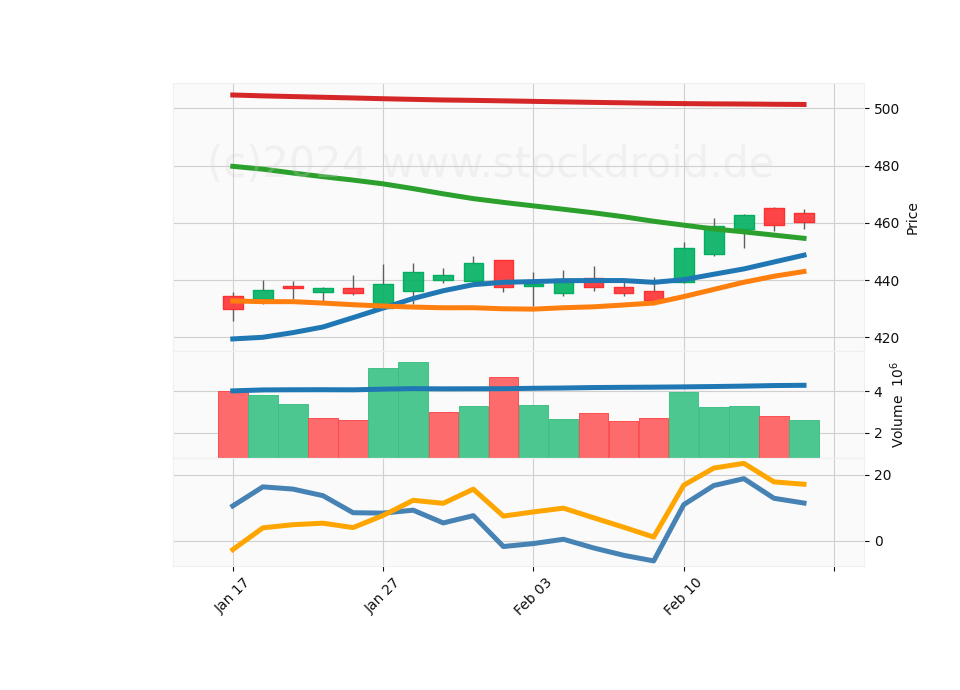
53915 |
2025-02-18 |
2025-02-12 |
ADBE |
458.00 |
462.76001 |
18.86445 |
23.52401 |
2.07778 |
1.4375 |
| 1 |
53914 |
2025-02-18 |
2025-02-11 |
ADBE |
449.00 |
458.82001 |
16.78667 |
22.08651 |
5.81555 |
5.2040 |
| 2 |
53913 |
2025-02-18 |
2025-02-10 |
ADBE |
439.25 |
451.10001 |
10.97112 |
16.88251 |
17.11222 |
15.7710 |
Start
MCD Yahoo Stock Infos
MCD Google Stock Infos
|
ID |
AquisitionDate |
Date |
Title |
Open |
Close |
Buy9 |
Buy20 |
DiffBuy9 |
DiffBuy20 |
| 0 |
53846 |
2025-02-18 |
2025-02-13 |
MCD |
307.50000 |
310.01999 |
10.73555 |
17.94649 |
0.05109 |
1.03398 |
| 1 |
53845 |
2025-02-18 |
2025-02-11 |
MCD |
307.37000 |
310.20999 |
15.21444 |
20.82349 |
-0.44335 |
0.46098 |
| 2 |
53844 |
2025-02-18 |
2025-02-10 |
MCD |
302.26999 |
308.42001 |
15.65779 |
20.36251 |
12.20113 |
12.81452 |
Start
HD Yahoo Stock Infos
HD Google Stock Infos
|
ID |
AquisitionDate |
Date |
Title |
Open |
Close |
Buy9 |
Buy20 |
DiffBuy9 |
DiffBuy20 |
| 0 |
53843 |
2025-02-18 |
2025-02-11 |
HD |
414.00000 |
416.35999 |
3.86777 |
4.13249 |
2.04334 |
1.01100 |
| 1 |
53842 |
2025-02-18 |
2025-02-10 |
HD |
410.64001 |
413.98999 |
1.82443 |
3.12149 |
7.15777 |
5.41499 |
Start
GILD Yahoo Stock Infos
GILD Google Stock Infos
|
ID |
AquisitionDate |
Date |
Title |
Open |
Close |
Buy9 |
Buy20 |
DiffBuy9 |
DiffBuy20 |
| 0 |
53893 |
2025-02-18 |
2025-02-13 |
GILD |
104.84 |
105.96 |
6.96111 |
9.6895 |
1.67667 |
1.9710 |
| 1 |
53892 |
2025-02-18 |
2025-02-12 |
GILD |
101.74 |
103.31 |
5.28444 |
7.7185 |
6.46333 |
6.5545 |
Start
NUE Yahoo Stock Infos
NUE Google Stock Infos
|
ID |
AquisitionDate |
Date |
Title |
Open |
Close |
Buy9 |
Buy20 |
DiffBuy9 |
DiffBuy20 |
| 0 |
53877 |
2025-02-18 |
2025-02-14 |
NUE |
136.22 |
137.77 |
3.32444 |
8.2835 |
1.50111 |
1.49950 |
| 1 |
53876 |
2025-02-18 |
2025-02-13 |
NUE |
133.52 |
135.55 |
1.82333 |
6.7840 |
1.20889 |
1.37650 |
| 2 |
53875 |
2025-02-18 |
2025-02-10 |
NUE |
136.80 |
137.53 |
6.38445 |
10.7390 |
6.05001 |
6.30151 |
Impressum Datenschutzerklärung © 2023, © 2024 stockdroid.de Letzte Aktualisierung: 18-02-2025