| Title | Description | Sector | MAX(Date) | Open | Close | Buy9 | Buy20 | Signals | |
|---|---|---|---|---|---|---|---|---|---|
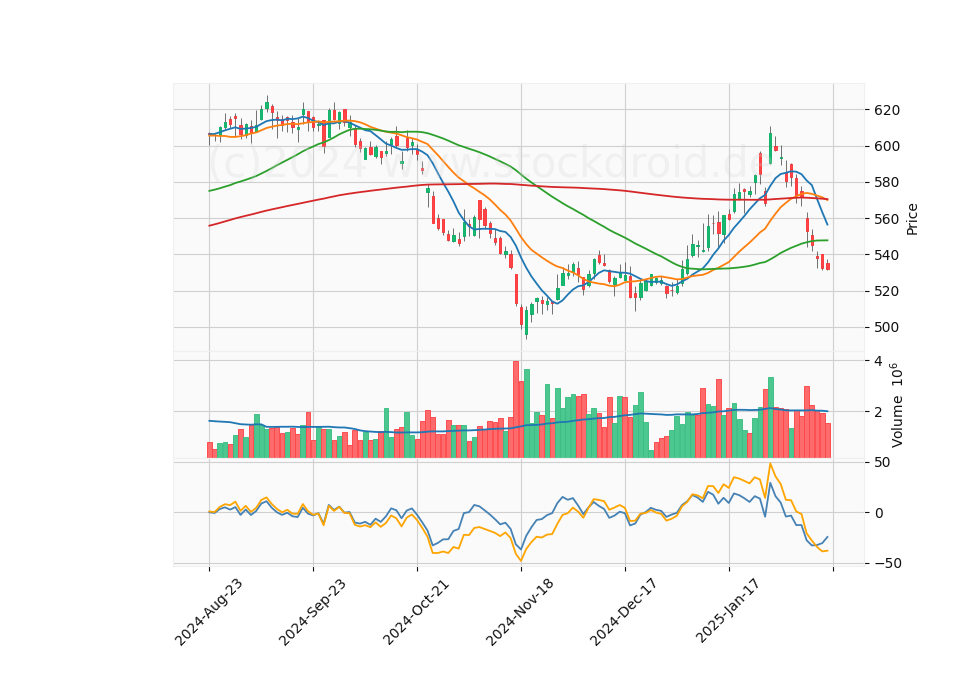
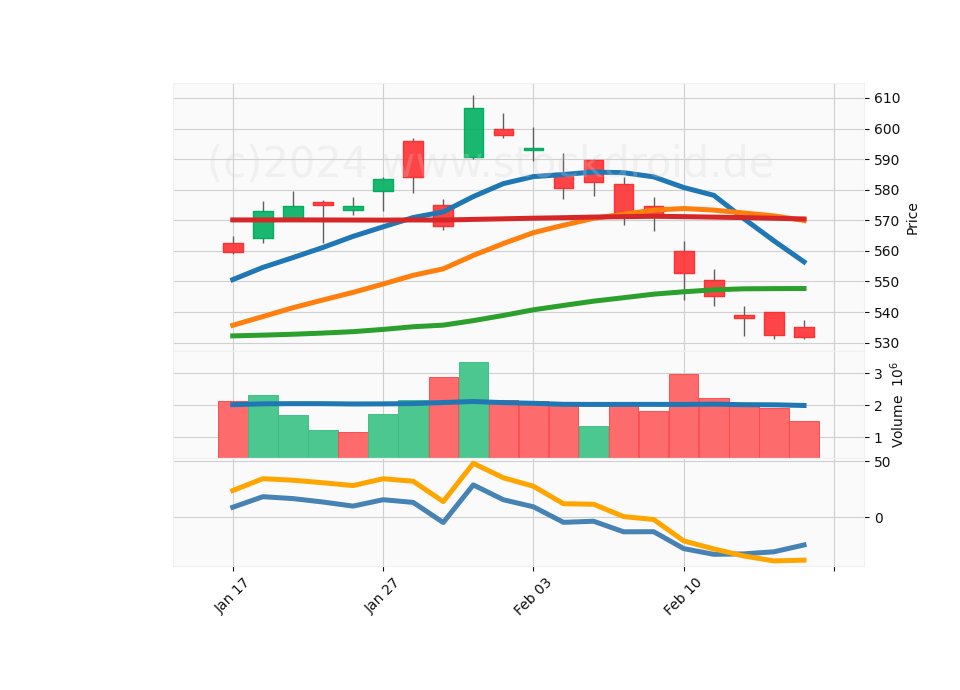
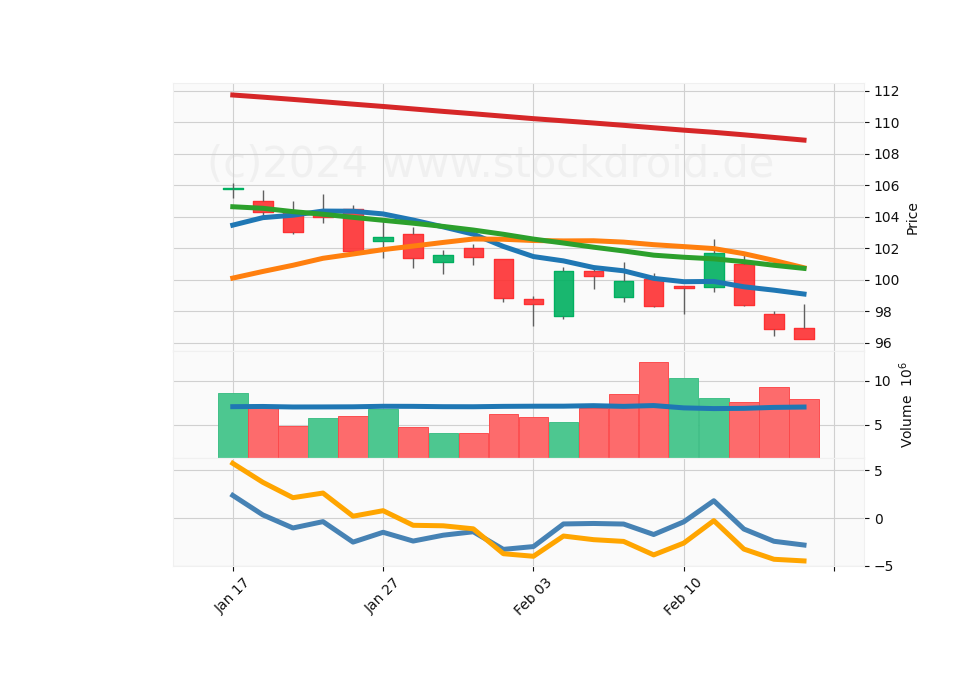
| 0 | TMO | Thermo Fisher Scientific Inc | Diagnostic & Research | 2025-02-14 | 560.09998 | 552.85999 | -27.85778 | -20.99251 | 5 |
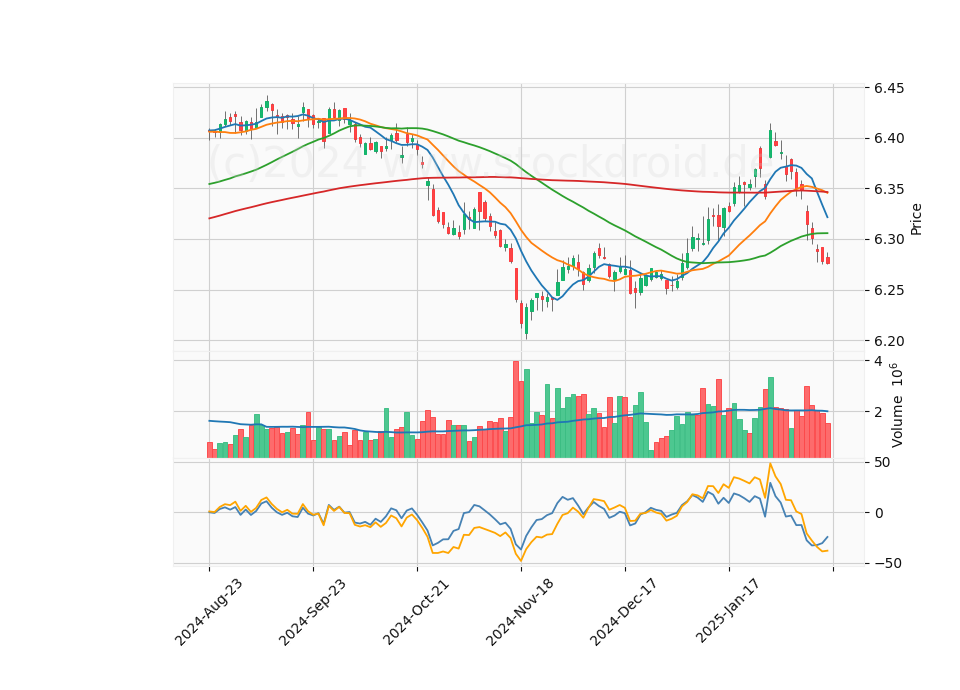
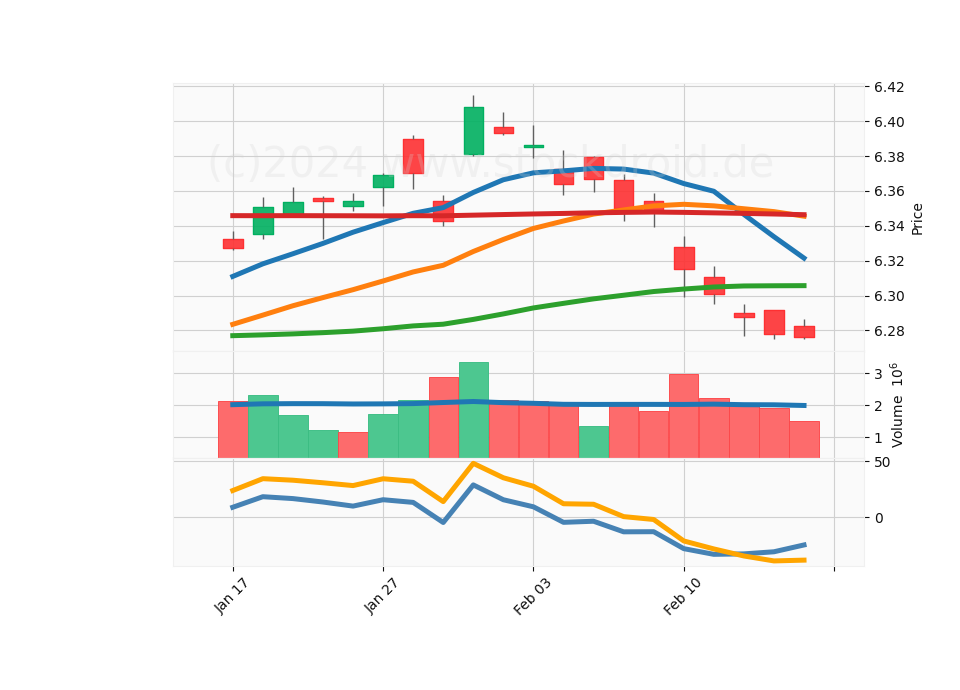
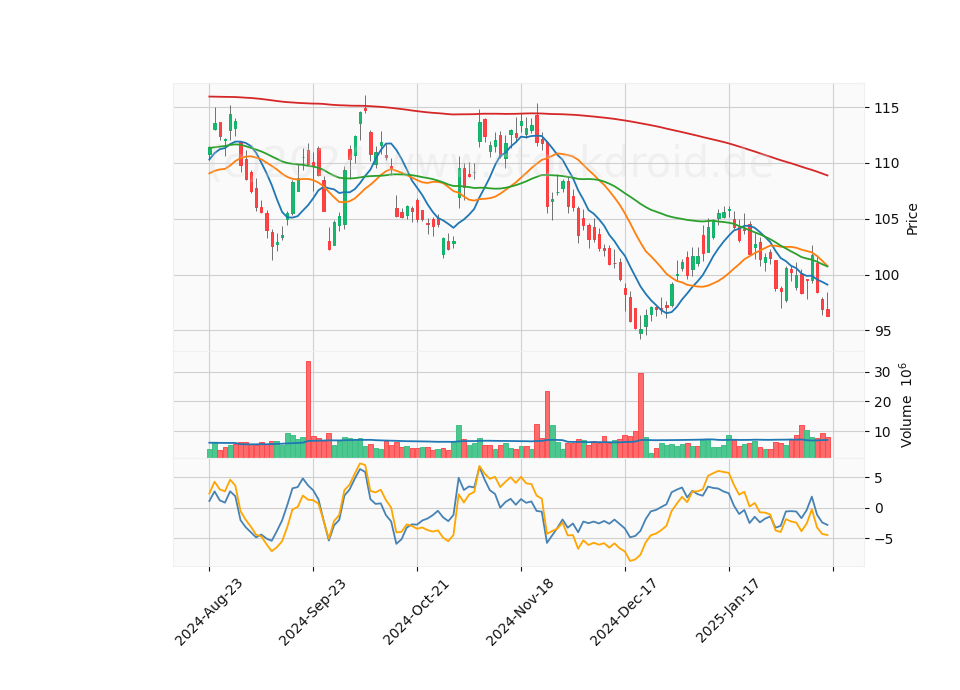
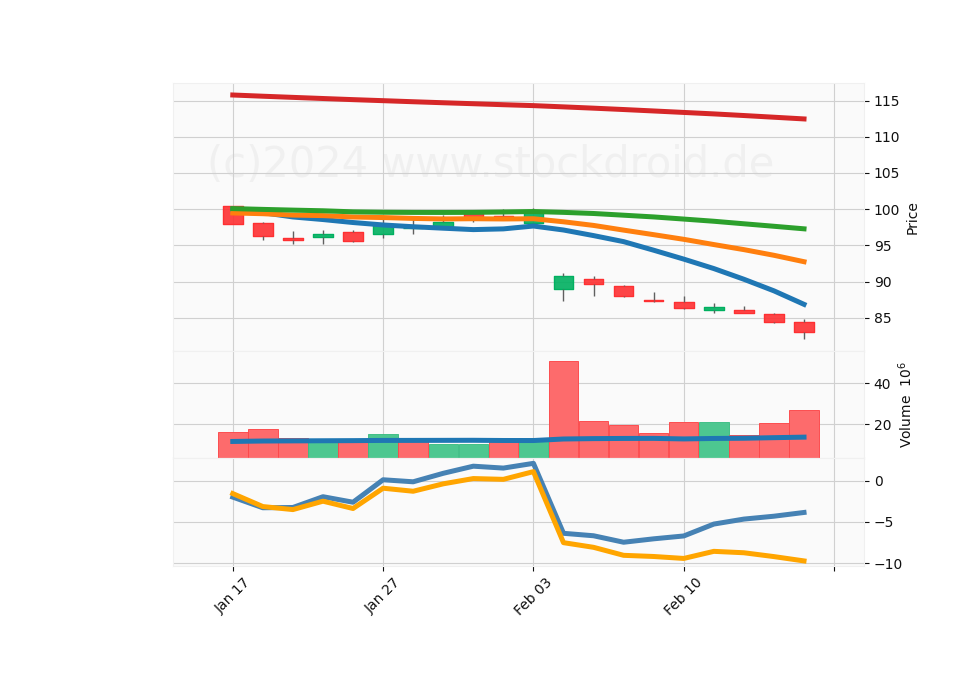
| 1 | COP | ConocoPhillips | Oil & Gas E&P | 2025-02-14 | 99.61000 | 99.48000 | -0.39778 | -2.62900 | 4 |
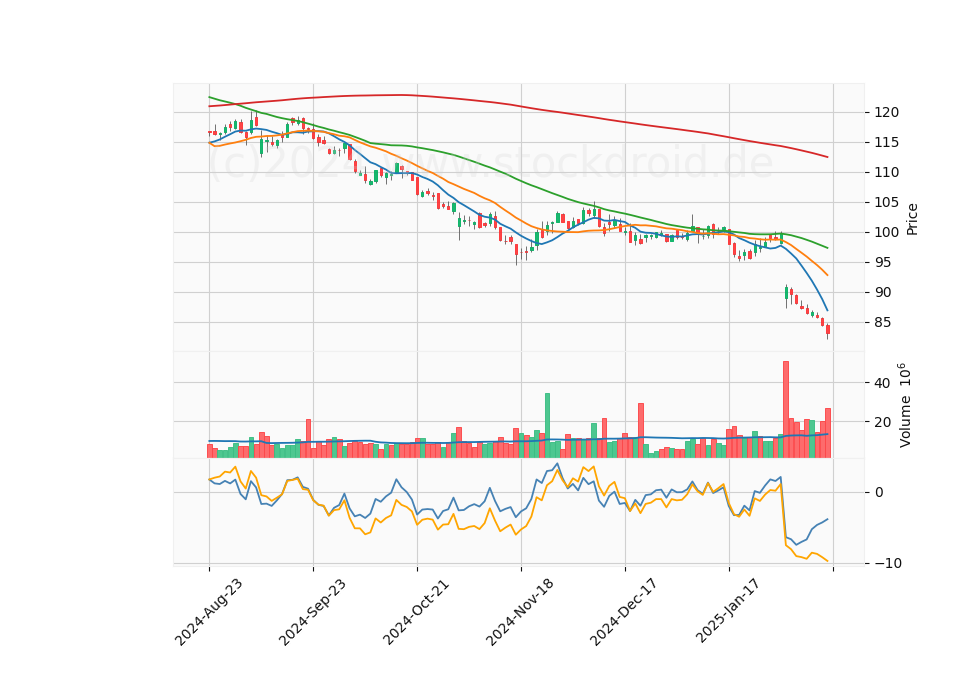
| 2 | MRK | Merck & Co. Inc. | Drug Manufacturers | 2025-02-14 | 87.20000 | 86.40000 | -6.70889 | -9.44050 | 4 |
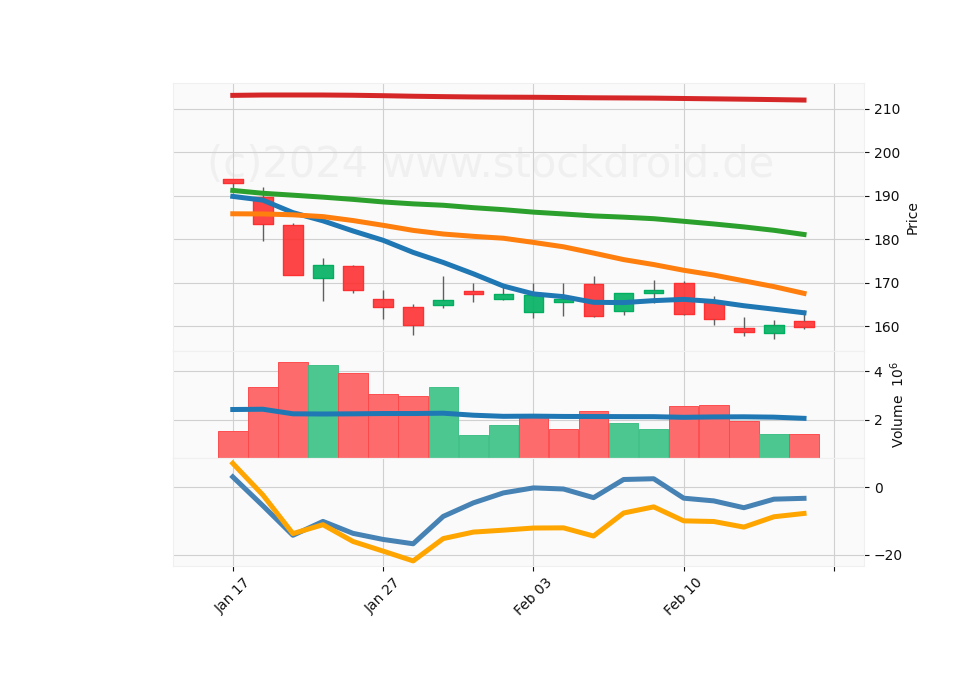
| 3 | FSLR | First Solar Inc. | Solar | 2025-02-14 | 169.94000 | 162.89000 | -3.28889 | -9.98400 | 4 |
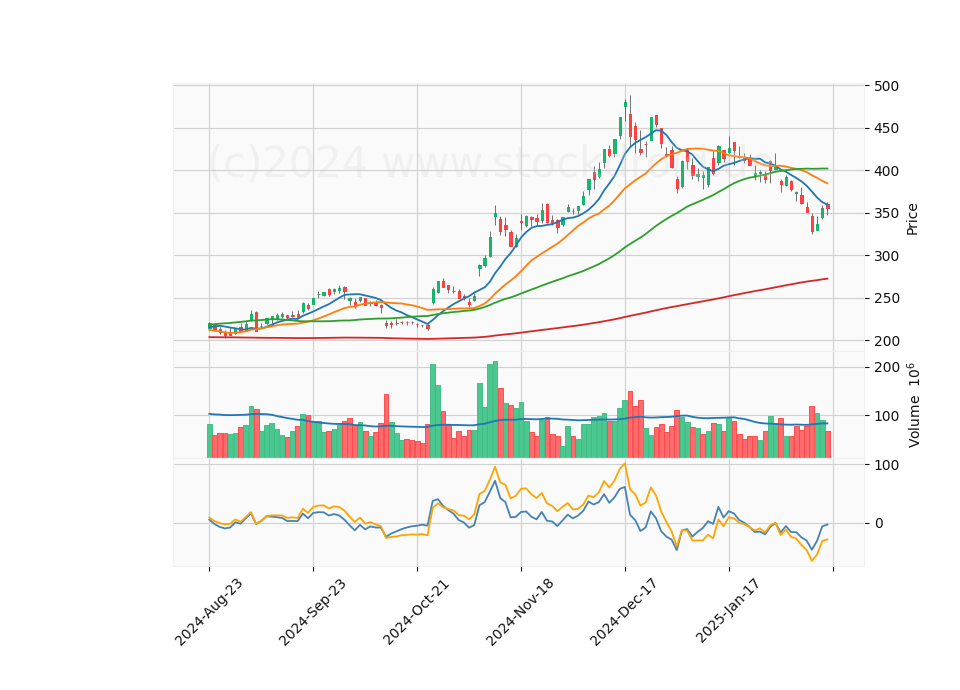
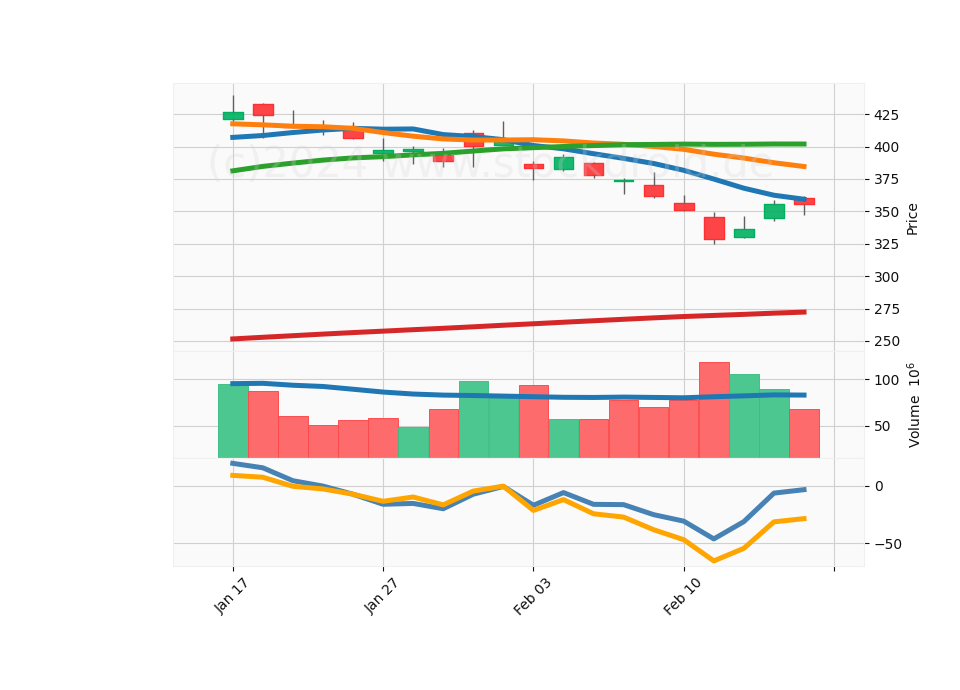
| 4 | TSLA | Tesla Inc. | Auto Manufacturers | 2025-02-14 | 356.20999 | 350.73001 | -30.90444 | -47.08499 | 3 |
| ID | AquisitionDate | Date | Title | Open | Close | Buy9 | Buy20 | DiffBuy9 | DiffBuy20 | |
|---|---|---|---|---|---|---|---|---|---|---|
| 0 | 37374 | 2025-02-18 | 2025-02-14 | TMO | 535.09998 | 531.84998 | -24.56224 | -38.10402 | 6.08775 | 0.70297 |
| 1 | 37373 | 2025-02-18 | 2025-02-13 | TMO | 540.00000 | 532.64001 | -30.64999 | -38.80699 | 1.87445 | -4.41849 |
| 2 | 37372 | 2025-02-18 | 2025-02-12 | TMO | 539.09003 | 538.00000 | -32.52444 | -34.38850 | 0.40780 | -6.28048 |
| 3 | 37371 | 2025-02-18 | 2025-02-11 | TMO | 550.48999 | 545.22998 | -32.93224 | -28.10802 | -5.07445 | -7.11551 |
| 4 | 37370 | 2025-02-18 | 2025-02-10 | TMO | 560.09998 | 552.85999 | -27.85778 | -20.99251 | -15.11776 | -19.13748 |
| ID | AquisitionDate | Date | Title | Open | Close | Buy9 | Buy20 | DiffBuy9 | DiffBuy20 | |
|---|---|---|---|---|---|---|---|---|---|---|
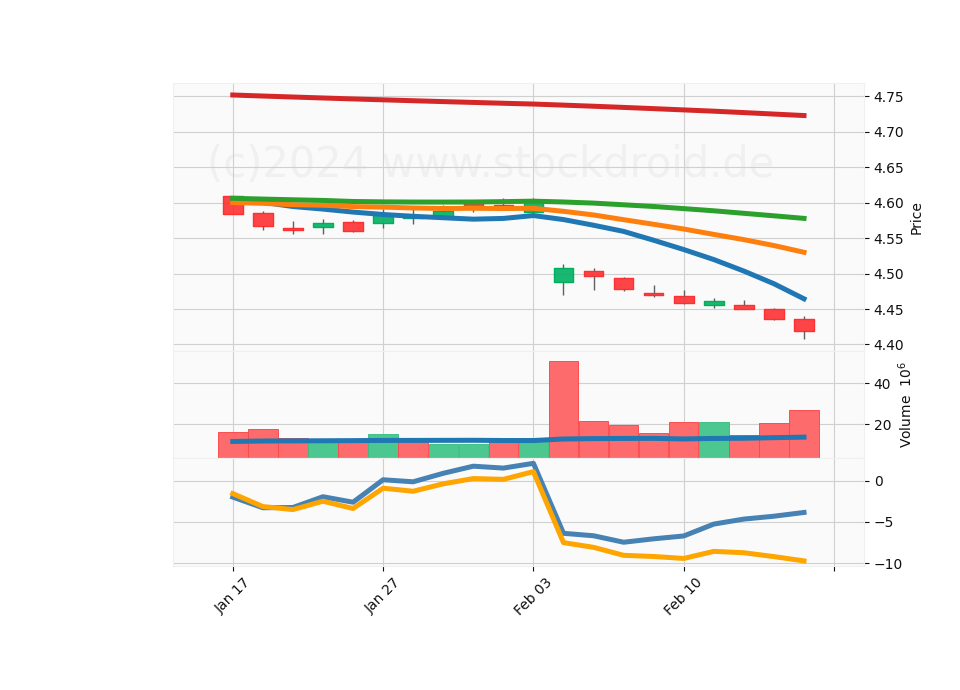
| 0 | 37335 | 2025-02-18 | 2025-02-14 | COP | 96.91 | 96.26 | -2.83333 | -4.5025 | -0.39333 | -0.1725 |
| 1 | 37334 | 2025-02-18 | 2025-02-13 | COP | 97.82 | 96.90 | -2.44000 | -4.3300 | -1.28556 | -1.0710 |
| 2 | 37333 | 2025-02-18 | 2025-02-12 | COP | 101.00 | 98.40 | -1.15444 | -3.2590 | -2.97000 | -2.9860 |
| 3 | 37332 | 2025-02-18 | 2025-02-10 | COP | 99.61 | 99.48 | -0.39778 | -2.6290 | 1.33111 | 1.2420 |

| ID | AquisitionDate | Date | Title | Open | Close | Buy9 | Buy20 | DiffBuy9 | DiffBuy20 | |
|---|---|---|---|---|---|---|---|---|---|---|
| 0 | 37360 | 2025-02-18 | 2025-02-14 | MRK | 84.42 | 83.01 | -3.85444 | -9.7415 | 0.45444 | -0.5255 |
| 1 | 37359 | 2025-02-18 | 2025-02-13 | MRK | 85.59 | 84.42 | -4.30889 | -9.2160 | 0.35000 | -0.4665 |
| 2 | 37358 | 2025-02-18 | 2025-02-12 | MRK | 86.07 | 85.67 | -4.65889 | -8.7495 | 0.60556 | -0.1710 |
| 3 | 37357 | 2025-02-18 | 2025-02-10 | MRK | 87.20 | 86.40 | -6.70889 | -9.4405 | 0.34778 | -0.2375 |
| ID | AquisitionDate | Date | Title | Open | Close | Buy9 | Buy20 | DiffBuy9 | DiffBuy20 | |
|---|---|---|---|---|---|---|---|---|---|---|
| 0 | 37386 | 2025-02-18 | 2025-02-14 | FSLR | 161.20000 | 159.75999 | -3.33001 | -7.79601 | 0.24555 | 0.97649 |
| 1 | 37385 | 2025-02-18 | 2025-02-12 | FSLR | 159.66000 | 158.61000 | -6.10333 | -11.82650 | -2.01445 | -1.65301 |
| 2 | 37384 | 2025-02-18 | 2025-02-11 | FSLR | 165.46001 | 161.60001 | -4.08888 | -10.17349 | -0.79999 | -0.18949 |
| 3 | 37383 | 2025-02-18 | 2025-02-10 | FSLR | 169.94000 | 162.89000 | -3.28889 | -9.98400 | -5.74444 | -4.13250 |
| ID | AquisitionDate | Date | Title | Open | Close | Buy9 | Buy20 | DiffBuy9 | DiffBuy20 | |
|---|---|---|---|---|---|---|---|---|---|---|
| 0 | 37315 | 2025-02-18 | 2025-02-14 | TSLA | 360.62000 | 355.84000 | -3.47556 | -28.72900 | 2.99333 | 2.79900 |
| 1 | 37314 | 2025-02-18 | 2025-02-11 | TSLA | 345.79999 | 328.50000 | -46.40111 | -65.57450 | -15.49668 | -18.48951 |
| 2 | 37313 | 2025-02-18 | 2025-02-10 | TSLA | 356.20999 | 350.73001 | -30.90444 | -47.08499 | -5.62777 | -8.68949 |